Energy mix

For many decades, coal has played a crucial role in Europe’s economic development and energy security. However, the European coal market is currently undergoing a profound structural transformation. Decarbonization policies, the rapid expansion of renewable capacities, rising carbon emission costs, and geopolitical changes have led to reduced production and consumption, as well as a reshaping of the European Union’s supply sources.
Where Romania stands in this change and what our main advantages are, we invite you to discover together atThe MacEN Area.
EU: FROM BASE FUEL TO HISTORIC LOW
The good news we start from today is that, at the European level, we are rapidly moving towards a much cleaner economic mix.
Lignite, the most common type of coal in Europe, with lower calorific value and higher emissions, recorded the sharpest decline. Three quartersSince 1990, lignite consumption has disappeared. With a spectacular evolution, the trend has been one of rapid decline:
In 2025, the EU's domestic lignite consumption is estimated at 184.74 million tonnes, with production at 185.05 million tonnes. The small difference confirms the local nature of the market: lignite is almost entirely consumed in the countries where it is extracted, and imports and exports are negligible.
ROMANIA'S POSITION
With a consumption of 12.35 million tons in 2025, we rankthe fifth in the EU, while Romania's share in European consumption has slightly increased, from 6.4% in 2020 to 6.7% in 2025, as EU consumption declined somewhat faster.
In 2025, domestic production covered approximately 99.1% of consumption. This does not mean the absence of challenges: lignite remains carbon-intensive, depends on a limited number of mines and power capacities, and its reduction must be synchronized with investments in grids, storage, flexible production, and renewable sources to limit risks to adequacy and prices.
CHANGE IN THE ELECTRICITY PRODUCTION MIX
In 2025, approximately 8.9 million peopleworked in the cultural sector in the European Union, representing 4.3% of all employed persons.
Cultural employment has overall experienced upward growth in the last decade. The number of people working in this field in the EU increased from approximately 7.6 million (2015) to nearly 8.9 million (2025), representing a rise of about 1.3 million people, or roughly 17%.
EUROPEAN UNION: ENERGY MIX EVOLUTION
1990 - 2025 | %
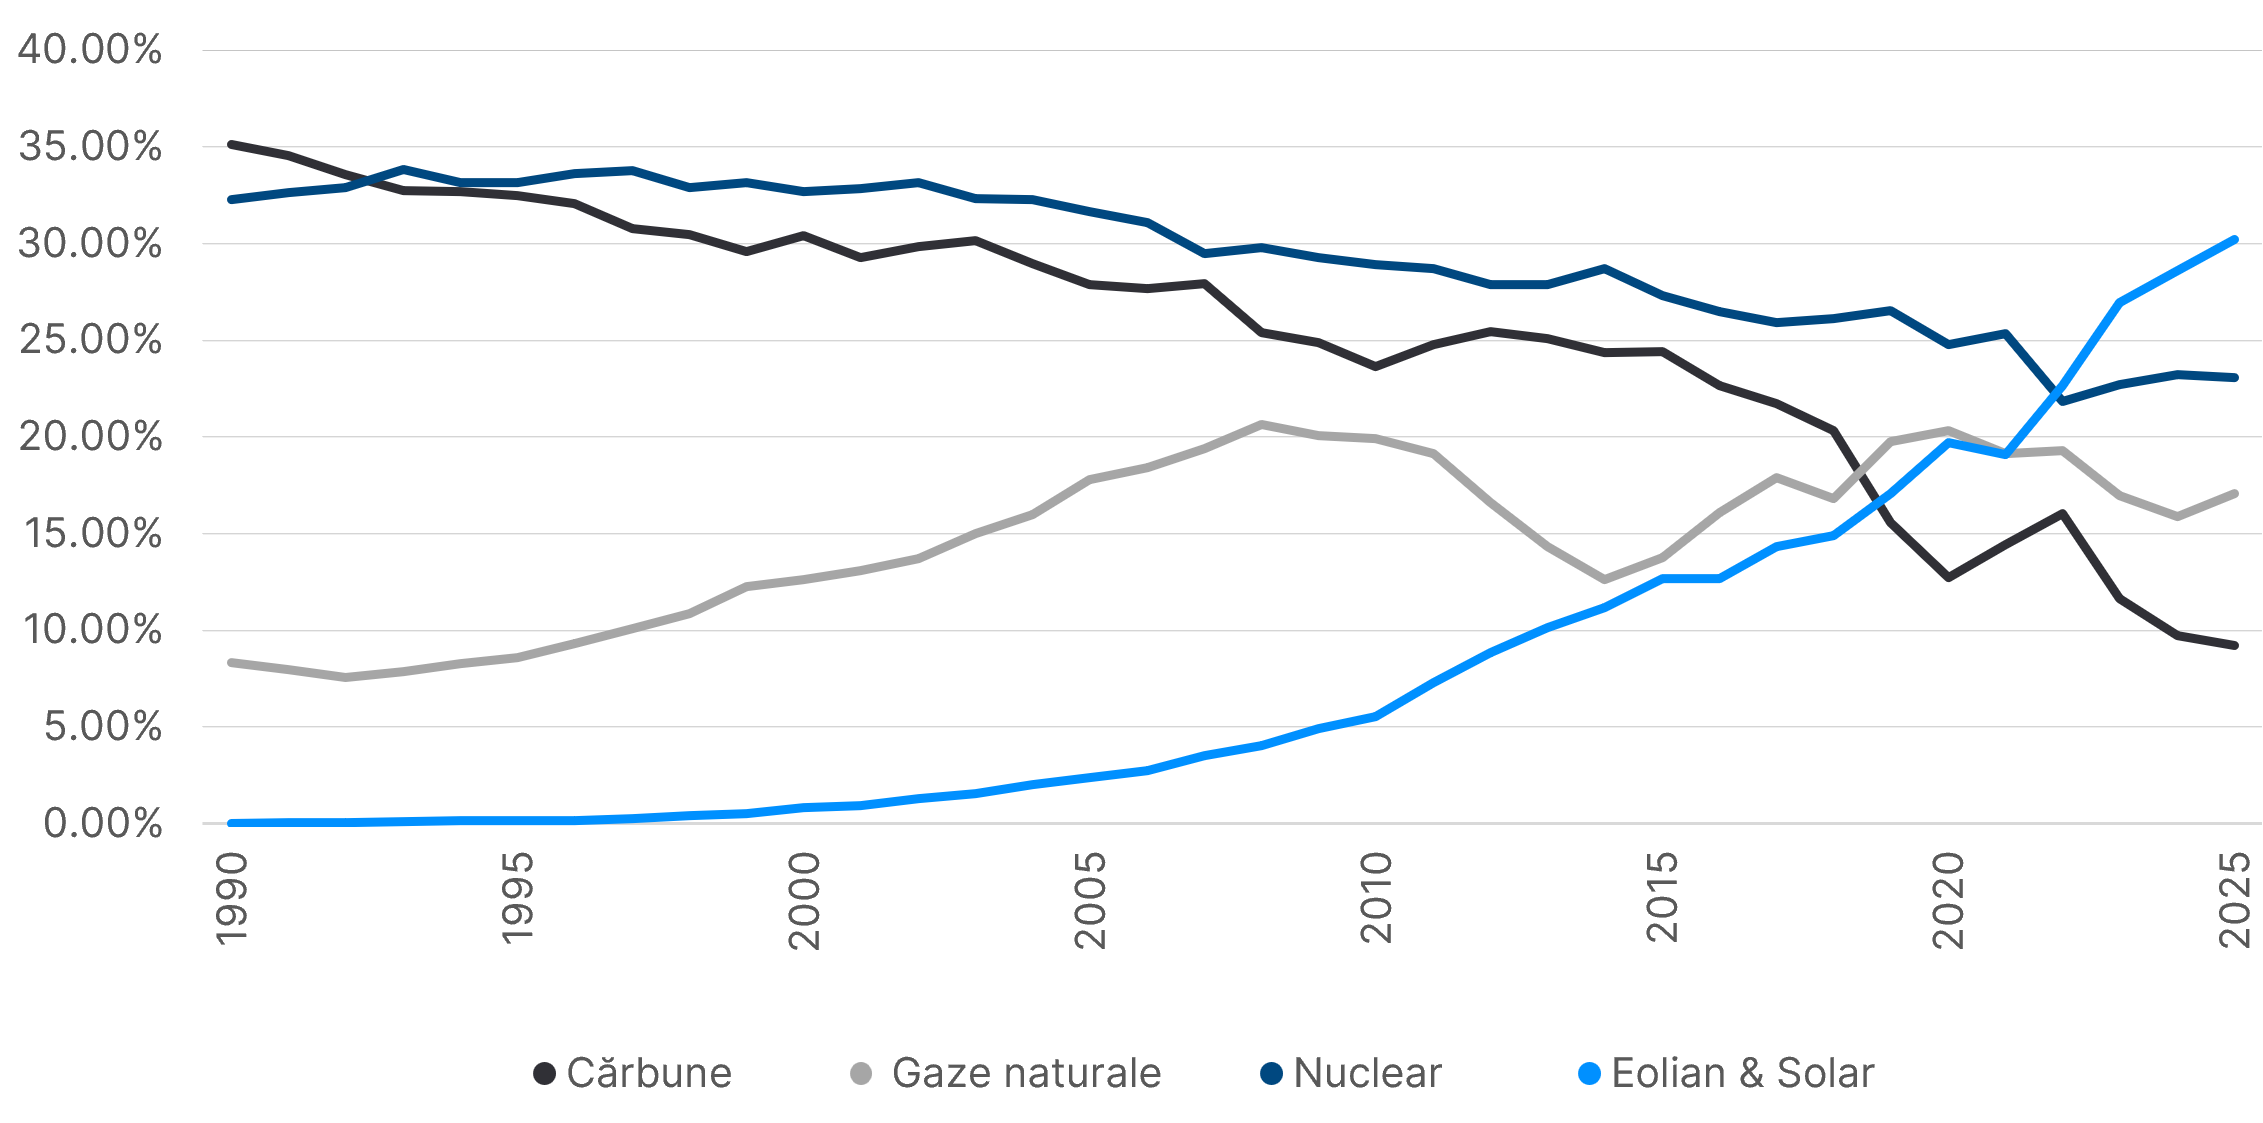
Coal was the most important source, accounting for 35.1% of production: 19.8% hard coal and 15.3% lignite. Nuclear energy still supplied 32.3%, so the two categories together made up over two-thirds of EU production. Hydropower accounted for 12.6%, gas 8.3%, while wind and solar were practically nonexistent. Renewable sources, including hydro and bioenergy, represented only 13.4%.
FUN FACT
In 1990, solar power produced only 16 GWh in the EU; by 2025, it reached approximately 371,736 GWh, more than23,000 times moreand about 1.4 times the combined production of hard coal and lignite.
The share of coal had dropped to 30.4%, while natural gas had risen to 12.6%. Nuclear remained steady at 32.7%, and hydropower at 13.3%. Wind power supplied only 0.8%, and solar was still negligible. This phase marks the beginning of replacing coal with gas, before the large-scale expansion of variable renewables.
Coal had dropped to 23.7%, while natural gas had reached 19.9%, the highest share among the reference years. Wind power had risen to 4.7%, solar to 0.8%, and renewables overall to 22.1%. Nuclear remained the main individual source, at 28.9%, although its share had started to decline.
In 2025, coal accounted for only 9.2%, of which 3.7% was hard coal and 5.5% lignite. Wind power had reached 17.0%, and solar 13.2%; together they provided 30.2%, more than three times the share of coal. Renewable sources totaled 47.2%, and together with nuclear 70.3%. Natural gas remained significant at 17.1%, including as a flexible source in a system with larger volumes of variable production.
CHANGE STEPS
#1The decline of coal was structural, with temporary recoveries
Production based on hard coal and lignite decreased from approximately 793 TWhin 1990 at 260TWhin 2025, a contraction of 67.2%. The decline accelerated after 2018. The recovery in 2021–2022, linked to the economic rebound and the energy crisis, did not change the trend: in 2023, coal production fell sharply again, reaching its lowest share in 2025.
#2Natural gas has shifted from a coal substitute to a source of flexibility
Gas production increased from around 188 TWhin 1990 at 481TWhIn 2025. The share quickly rose to almost 20% in 2010, then fluctuated depending on fuel prices, nuclear and hydro availability, demand, and the geopolitical context. In 2025, gas supplied 17.1%, a high share but below the 2010 peak.
#3The wind and solar sectors have caused the biggest structural break
Eolianul increased from less than 1 TWhin 1990 at 480TWhin 2025, and the solar at just 0.016TWhat approximately 372TWh. Together they surpassed coal in share even before the end of the period. In 2024, solar alone exceeded the combined production of hard coal and lignite for the first time. This development reduced emissions and fuel imports but increased the need for grids, interconnection, storage, and flexible demand response.
#4Nuclear and hydro remain pillars, but with different weights
Nuclear output decreased moderately, from 729 TWhin 1990 at 651TWhin 2025, while its share dropped from 32.3% to 23.1%. The decrease reflects the closure of some capacities and the variable availability of the nuclear fleet. Hydropower increased in volume by approximately 12%, but its share slightly declined, from 12.6% to 11.3%, being strongly influenced by hydrological conditions.
ROMANIA IN RELATION TO THE EU
Romania hasre a diversified mix: latestdate usshowă că no source exceeded 27%, and the top four (hydro, nuclear, gas, and lignite) had significant contributions. This diversification reduces dependence on a single fuel but does not eliminate climate, flexibility, and emissions vulnerabilities.
⭐ STARS
Hydropower: the main comparative advantage
• Hydropower supplies 26.7% of Romania's production, double the EU average of 13.2%. Romania rankedfifth place in the EU by share, after Austria (58.0%), Croatia (44.2%), Sweden (37.5%) and Slovenia (31.9%). The advantage is significant for emissions and system balancing, but dependence on hydrology can cause annual volatility.
A strong hydro-nuclear base
• Hydro and nuclear together accounted for47,3%in Romania, compared to 36.5% in the EU. The share of nuclear, at 20.6%, was slightly below the EU average but large enough to provide stable low-emission production. The EU leaders in nuclear were France (67.3%), Slovakia (61.6%), Hungary (42.2%), Belgium (41.3%), and Bulgaria (41.1%).
Diversification of sources
• Romania is not predominantly dependent on a single technology. By comparison, some European systems have much higher concentrations: France in nuclear, Austria in hydro, Denmark in wind, or Ireland and Italy in gas. Romania’s diversification is an asset for resilience, provided the sources are supported by adequate networks and flexibility.
THE IMPACT OF A DIVERSIFIED MIX
| • Energy price: A mix with more solar and wind tends to reduceă prices inmarketă during peak production hours. But an unbalanced mix or insufficient networks și fărăcapacity ofstorage,it can also generate price spikes during hours when renewables do not produce. | • European funds: The energy transition is one of the EU's major financing priorities. Romania has access to significant funds through the Modernization Fund and the PNRR for renewable projects, networks, and storage. The absorption capacity of these funds will determine the speed of the transition. | |
| • Industry Competitiveness: Energy-intensive companies (steel, chemicals, aluminum, cement) are directly affected by energy costs. Therefore, a favorable energy mix can stimulate the industry by prețsmaller URLs. | • Energy security: The diversified mix protects against external shocks: if gas prices rise, hydro and nuclear compensate. If one year is dry, the other sources cantake over the gapleft in the mix. |
💪 WORK IN PROGRESS
Solar: the largest gap compared to the European average
• Solar accounted for 6.5% in Romania, compared to 11.0% in the EU, a deficit of 4.6 percentage points. The leaders by share were Hungary (24.2%), Spain (20.7%), Greece (19.6%), the Netherlands (17.6%), and Estonia (16.7%). This is the main area for recovery, provided that storage, grids, and flexibility are developed simultaneously to manage production concentrated during sunny hours.
Eolian: high potential, insufficient development
• Wind power accounted for 12.0% in Romania, 5.6 percentage points below the EU average of 17.5%. The leaders were Denmark (58.2%), Ireland (37.4%), Germany (27.4%), the Netherlands (27.1%), and Finland (25.4%). Romania has competitive wind resources, including in Dobrogea, and potentialoffshore, but progress depends on connection, network strengthening, and investment predictability.
Lignite: share above the EU average
• Coal accounted for 15.0% in Romania, entirely lignite, compared to 9.7% in the EU. A higher share is not an achievement but indicates an additional need for transition.
THE PLAN FOR THE NEXT PERIOD
Overall, the evolution over the past three decades shows that the phase-out of coal from the European energy mix is irreversible, even though the pace varies from country to country. For the European Union, the challenge is integrating an increasing volume of renewable production while maintaining supply security.
For Romania, the goal is to turn the hydro-nuclear base into a long-term competitive advantage by complementing it with wind, solar, storage, and modern infrastructure, while managing the balanced phase-out of lignite. We have the raw materials—from the wind in Dobrogea and the sun in Oltenia to the gas in the Black Sea and nuclear energy from Cernavodă, Romania has the resources needed to build one of the most diversified energy mixes in Europe; what we lack is execution speed.