Consumption structure

If you wanted to explain the difference in living standards between Romania and Western Europe without using GDP or average salary, how would you do it?
We propose taking a look at the consumption structure within a family budget. For a moment, we set aside the total amount and focus on how the budget is divided. The structure of household expenses reveals a lot about the economy, showing us exactly what is a priority and which expenses are discretionary.
Eurostat data offers us this perspective, and the comparison between Romania and the EU average brings a few insights which we invite you to analyze together in a new episode of The MacEN Area .
BUDGET STRUCTURE
The structure of a household budget reveals a lot about the level of economic development, the population's purchasing power, and consumption priorities.
The lower the income, the larger the share of the budget allocated to basic needs such as food, housing, and transportation. As income increases, consumption diversifies, and households allocate more resources to services, recreation, travel, dining, or financial products.
According to the data Eurostat, in January 2026, almost half (46%) of EU households' budgets were allocated to three essential categories: food and non-alcoholic beverages, housing and utilities, and transport.
These weights represent the structure of monetary consumption expenditures used to calculate the CPI. The weights are updated annually, mainly based on the previous year and adjusted to December prices. The changes reflect both shifts in consumption behavior and the relative price evolution, as well as updates to statistical sources.
EUROPEAN BUDGET
In 2026, at the European Union level, the structure of consumer spending showed a relatively diversified budget. The top three categories by share are food and non-alcoholic beverages (16.3%), housing, utilities, energy (14.9%), and transport (14.7%). In other words, out of every 100 euros spent in an average European household, approximately €46 covers basic needs.
After the three essential expenses come restaurants and accommodation services (10.7%), as well as recreation, sports, and culture (8.5%). Together, these two categories account for nearly one-fifth of the consumer budget. Their share highlights the importance of services, leisure activities, and discretionary spending in European economies.
Compared to 2025, European consumption shifted more towards recreation and services. The share of spending on recreation, sports, and culture increased by 1.2 pp, that on restaurants and accommodation by 0.3 pp, and education by 0.1 pp. In contrast, transport and communications recorded declines. These changes indicate a partial reorientation of consumption towards recreational activities and services, although the shares are also influenced by the relative price developments.
STRUCTURE OF ROMANIANS' CONSUMPTION
The budget structure of a household in Romania is significantly more concentrated than the European average. In 2026, over a quarter of total monetary consumption expenditure was allocated to food and non-alcoholic beverages. Transport accounted for 12.7%, while housing and utilities made up 11.0%. Together, these three categories totaled 51.1% of the budget. Thus, in Romania, over half of the budget is concentrated on three essential categories.
If we also include health expenses, almost 60% of the consumption budget was already allocated to the four categories. While the remaining 40% must cover clothing, recreation services, restaurants, education, insurance, and other expenses, for a household with a monthly income of 5,000 lei, this means about 2,000 lei remain for all other categories.
Thus, the available space for discretionary spending remains quite limited, being much more restricted than in the case of the average European household.
UBUDGET STRUCTURE IN ROMANIA AND THE EU
2026 | %
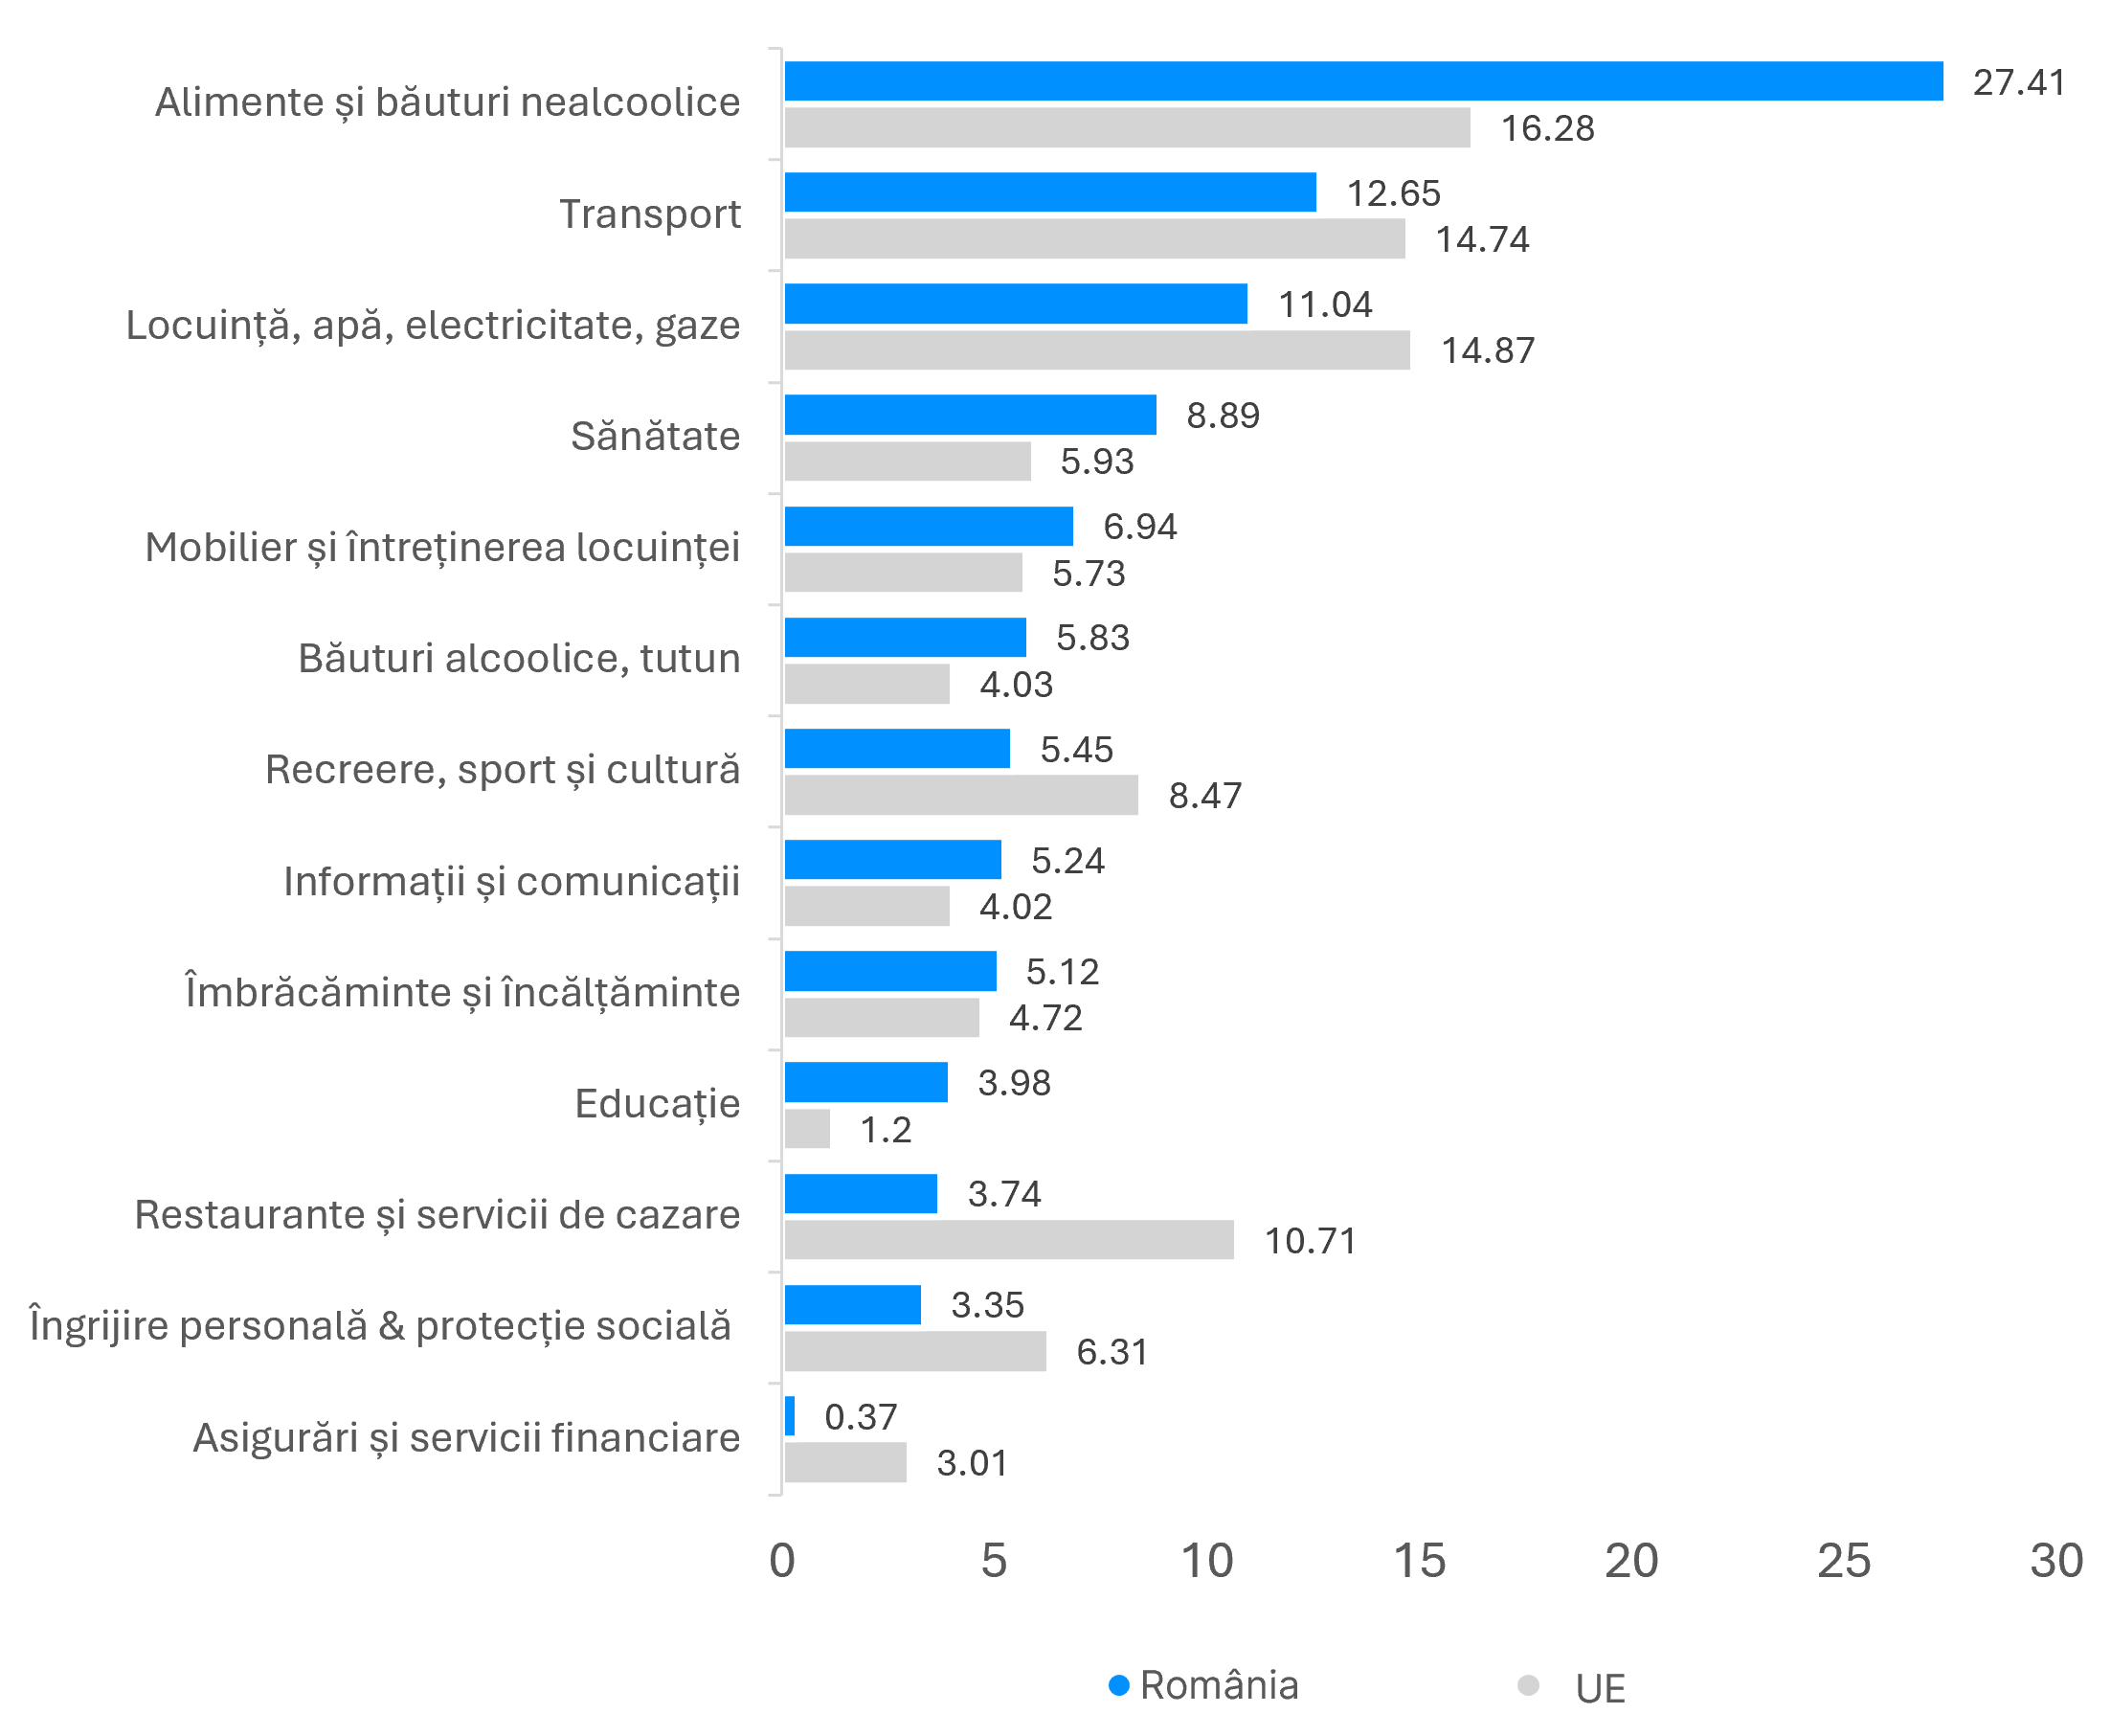
• We spend relatively more on health (8.89%) and education (3.98%) than the European averages (5.93% for health and 1.20% for education), all needs that are hard to avoid or postpone. The flip side is that, by allocating so much money to these categories, much smaller amounts remain for discretionary spending or for supporting a higher quality of life, whether it concerns restaurants and travel (3.74% Angol vs 10.71% EU) or recreation (5.45% Angol vs 8.47% EU).
• The biggest difference is found in the case of food and non-alcoholic beverages, where we see an 11 percentage point gap indicating much greater pressure that food needs exert on Romanian budgets.
STRUCTURE EVOLUTION, DEPENDENT ON INCOME CONVERGENCE
The lower shares for restaurants, accommodation, recreation, and financial services reflect both lower disposable incomes and differences in consumption behavior, infrastructure, and access to services. A larger portion of food consumption takes place at home, while the use of restaurants and accommodation services is less frequent than the EU average. The insurance and financial services markets are also less developed.
In the coming years, income convergence should gradually bring Romania's consumption structure closer to the European one. The share of food could continue to decline, while recreation, tourism, restaurants, personal care, and financial services could gain ground. This does not mean that the population will spend less on food in nominal terms, but that these expenses may grow more slowly than incomes and total consumption.
The process will not be linear, however. Housing and energy costs may remain high, which would keep pressure on budgets. At the same time, an aging population, the expansion of private medical services, and increased direct household spending could keep the share of health expenses above the European average.
CONSUMER TRENDS IN ROMANIA & NEW PERSPECTIVES
As real incomes rise and our proximity to Western countries increases, the structure of the Romanian budget will follow minta-ul European, care, in some categories, is already on the horizon:
• Recreation, sports and culture: Although still at a low level compared to the European average, the percentage rose from 3.77% (2024) to 5.45% (2026), an increase of almost 1.7 percentage points. This trend may represent an initial sign of consumption diversification and a larger share of income being directed towards leisure activities.
• Insurance and financial services: Another major difference is the weight of only 0.37% for ainsurance and financial services, compared to 3.01% at the EU level. The figure highlights the low level of insurance usage, differences in financial depth, and the still low level of financial intermediation. However, the gap also reveals an important strength of the financial market, which implies a potential for up to 8 times growth in the insurance sector, long-term savings, and financial services targeted at the population.
ROMANIA, BEYOND BASIC NEEDS
The household budget structure shows that Romania is in a transition process. Consumption continues to be dominated by basic needs, with food alone accounting for over a quarter of total expenses. At the same time, the decrease in the share of food and the increase in spending on recreation and education indicate the beginning of a diversification of consumption.
Compared to the average European household, Romanian households spend proportionally more on food, health, and education, and much less on restaurants, accommodation, recreation, and financial services. As incomes continue to rise, this structure should move closer to the European one. However, the speed of convergence will depend not only on wage dynamics but also on the evolution of prices for food, energy, and housing, the development of services, and households’ ability to turn income growth into more diversified consumption.